Friday, September 29, 2006

Deck Family Farm Website is Up


I've been posting farming related topics over the last year in conjunction with my more nerdly posts on GIS. We now have a website for our farming venture at Deck Family Farm. Check it out if you are interested in natural meats. We are starting to take orders for direct-shipped frozen meat boxes!

Tuesday, August 29, 2006

Fence for home on a farm update

Here is a photo of the fence that I wrote about last November. Most of it is done with the exception of gates. I am very pleased with the design as the fence went up pretty quick, even counting the phone and septic lines we managed to precisly locate with our auger.

In the photo is a small section of cob wall we have near our front gate. The cob is built using Oregon Cob, a new method based on a very old technique using clay, sand, and straw to build the wall. The straw acts like rebar, holding the whole mass together, while the clay holds the sand together, and the sand adds the mass. We have yet to put the outer coat on, which will be a clay-dung (yes, its dung-- we are going to use llama poop) mix and on top of that a linseed oil/ beeswax mix.

Friday, June 02, 2006

Alternatives to Synthetic Nitrogen Fertilizer

We are raising organic beef. Though we are not certified at this time, we are following the rules. One particular aspect of being organic is not using synthetic nitrogen fertilizers. This is a big deal when most livestock producers around you are using synthetic nitrogen. The benefits touted are more grass for hay and forage and the grass responding to the nitrogen will respond better than the weeds. In the words of one rancher on our decision to not use synthetic nitrogen fertilizer- "You won't get nothin' from that land without it".

After some reading its clear that there are a number of ills associated with using synthetic nitrogen, including: reliance on fossil fuels to produce it, changing soil chemistry, investing in methods requiring intervention as opposed to using time & energy in other methods that may be more productive.

A few sites detailing the ills of synthetic nitrogen:

http://hollandimac.chem.rochester.edu/n2cycle.pdf

http://www.nofa.org/tnf/nitrogen.php

http://www.farmandranchguide.com/articles/2006/05/25/bullseye/production_news/prod10.txt


Finally, i mentioned "other methods" above that could be used instead of synthetic nitrogen. This is where I want to begin to focus my attention. Some ideas are:

1) Management intensive grazing. For reading see: http://www.amazon.com/gp/product/0961780738/102-1149708-9712913?v=glance&n=283155

2) Overseeding legumes. Legumes fix nitrogen so used in permanent pastures can have a positive impact. Timing on this is critical.

3) Planting combinations of early & late season grasses to extend the grazing season. (I have some references on this that i'll post when i find them)

4) Fencing off creeks and providing water in the pasture. This helps keep nutrients on the pastures where they belong instead of the creeks where they cause no end of problems. We are pursuing options with WRP and CREP currently to help fence our nearly 2 miles of creek frontage.

More on this topic later!

Thursday, May 18, 2006

MapWiki

My friend Collin Bode and I were sitting around one afternoon bouncing ideas around & through a lemonade and a beer. The big idea came up to create MapWiki. The name says it all. I realized later others have done this. (e.g. http://www.citeulike.org/user/ianturton/article/559523).

We specifically wanted something that could integrate well with natural history collections databases and also include spatial certainty, linking back to source specimen records, and a registry of organizations and names.

Anyway, a rough prototype lives at: http://mapwiki.berkeley.edu/

Thursday, February 23, 2006

Layerwing WMS services with GoogleMaps >= v2.36

With the change in code in the Google Maps API v2.36, some things broke in my previous post about how to do WMS layering in V2 of Google Maps. I've posted a working sample of the WMS code for v2.36 and up here.

NOTE #1 (June 9th, 2006): I deleted the code references in the blog and instead point people to the sample link above, where a working version of the code is maintained (the key component is the file called wms236.js).

NOTE #2 (June 9th, 2006): Thanks to Guilhem Vellut for fixing up some Javascript code to make the Mercator Projection work more accurately. Now, it can be used at all zoom levels.

Attributions:
->Mike Williams http://www.econym.demon.co.uk/googlemaps2/ V2 Reference & custommap code

->Brian Flood http://www.spatialdatalogic.com/cs/blogs/brian_flood/archive/2005/07/11/39.aspx V1 WMS code

->Kyle Mulka http://blog.kylemulka.com/?p=287 V1 WMS code modifications

->http://search.cpan.org/src/RRWO/GPS-Lowrance-0.31/lib/Geo/Coordinates/MercatorMeters.pm

->Modified by Chris Holmes, TOPP to work by default with GeoServer.

->Guilhem Vellut for more accurate Javascript Mercator Fxn

Friday, January 27, 2006

Layering WMS services using GoogleMaps API V2


NOTE: I changed this posting substantially on February 1st as the previous code did not work when using GPolyline methods. This code now works with polylines.

Here is my method for creating GoogleMaps API V2 WMS Layers. In version 1, I started with code developed by Brian Flood and Kyle Mulka and ended up re-writing most of that class for V2 using code and examples from Mike Williams. The dd2Mercator conversion bits can be left off if dealing with small scale maps only.

Click here for a working example of this code. NOTE: On June 9th, i deleted the code references in this blog and instead refer people to view the source of the working example linked to above.

Tuesday, November 08, 2005

Fence for home on a farm

Since moving to our farm a little more than a year ago, we've acquired an assortment of animals: geese, chickens, dogs, goats, llamas, etc... Some of the more annoying of these animals are very good at escaping from designated pens and finding their way to our porch and pool and laying waste to vegetation, pooping on our mats, defecating in the pool. sheesh!

It became abundantly clear, at least to me, we need a fence to keep out the riff-raff from our home area. The fence needed to be aesthetic, not too tall to block our view over the top, and inexpensive. We have heard that deer do not like to jump fences they cannot see through, but we didn't want to spend the $ on a pure wood fence. Hence we decided on a wire mesh fence created with treated fir posts.

Here is the design: 5' treated fir posts (3-4" diameter) set 2' in the ground with 3/4" gravel surrounding. The gravel is 3/4" open (meaning there are no smaller pieces than 3/4"-- it does not pack as tight as a 3/4" minus but drains a bit better. We figure the top posts will help secure the fence itself so we don't have to worry too much about packing). The posts are braced on the top with another post that is notched to sit firmly on top of each post. The posts are spaced 10' apart from each other with 5" galvanized spikes holding the tops in place. We will be using a 2"x4" welded mesh wire stapled to the posts and stretched (not too tight!) and held in place with staples. The galvanized mesh is 36" high. When the fence is done, we will be planting vines, shrubs, and some small trees along the fence to create a visual barrier for animals attempting entry or perhaps jumping.

Approximate cost of fence:
100 10' 3-4" treated fir posts .... $700
9 rolls 2x4" welded wire,36" high... $385
~4 tons 3/4" Open gravel ..... $40
5" galvanized spikes .... $65
plants, etc.... $200

Many thanks to the Tilt-Reuben Family who helped us start this project a couple of weeks ago. I'll post some pictures in a few weeks when we hope to have this project completed!

Thursday, September 15, 2005

Overlaying Mercator Projected WMS Layers on GoogleMaps

One troubling aspect of the GoogleMaps API is their use of the Mercator Projection. This projection is not so bad for looking at large-scale maps (zoomed in), but is awful for visualizing small-scale (zoomed out) data, due to the large degree of exaggeration of land masses near the poles. Making matters more complicated is the fact that most Mercator Projections deal in meters as units while GoogleMaps delivers content to and from their API in decimal degrees. This makes things difficult especially when layering global WMS layers on GoogleMaps.

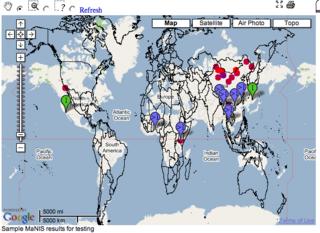
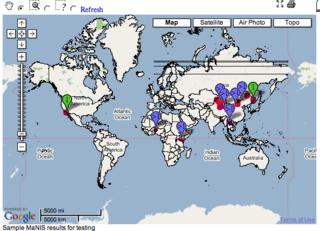
The screenshot to the left illustrates what happens when layering country boundaries from a WMS using a geographic projection on top of GoogleMaps. The interesting thing is that if we were to zoom in on a particular portion of the world, the boundaries would line up. This is why many people are able to use a geographic projection with Google Maps if only using for large-scale mapping projects.

OK, so what if we wanted to utilize a Mercator Projection from a WMS service on top of GoogleMaps? Here is how I did it, using Mapserver and Proj4 for the WMS content (details at the mapserver website):

1. Add the appropriate Mercator definition in the Proj4 EPSG file:
# Mercator
<54004> +proj=merc +lat_ts=0 +lon_0=0 +k=1.000000 +x_0=0 +y_0=0 +ellps=WGS84 +datum=WGS84 +units=m no_defs <>

2. Alter the Mapserver Map File so the Output Projection looks like:
PROJECTION
"init=epsg:54004"
END

3. Add the epsg:54004 projection definition to the WEB section of the Mapfile like:
WEB
METADATA
"wms_srs" "EPSG:4326 EPSG:54004"
.....

4. Make sure that the layers in the mapfile reflect their native projection.

5. Alter the Javascript in the GMaps_WMSSpec_0.1.js code (references to the source of this code appear in an earlier post). Primarily, I added two functions to convert decimal degrees to Mercator Meters so the GoogleMaps API can call the WMS service in a language it can understand:

// dd2MercMeters Conversion Functions
// from http://search.cpan.org/src/RRWO/GPS-Lowrance-0.31/lib/Geo/Coordinates/MercatorMeters.pm
//
var MAGIC_NUMBER=6356752.3142;
var DEG2RAD=0.0174532922519943;
var PI=3.14159267;
function dd2MercMetersLng(p_lng) {
return MAGIC_NUMBER*(p_lng*DEG2RAD);
}
function dd2MercMetersLat(p_lat) {
if (p_lat >= 85) p_lat=85;
if (p_lat <= -85) p_lat=-85;
return MAGIC_NUMBER*Math.log(Math.tan(((p_lat*DEG2RAD)+(PI/2)) /2));
}

6. Make a couple of alterations in the WMSSpec.prototype.getWMSURL function. Attached here is the whole function as I code it:

WMSSpec.prototype.getWMSURL=function(a,b,c, url, layers, format) {
if (!this.Styles) this.Styles="default";
var ts = this.tileSize;
var ul = this.getLatLng(a*ts,(b+1)*ts, c);
var lr = this.getLatLng((a+1)*ts, b*ts, c);
// user mercator for small scale
if (map.getZoomLevel() > 12) {
var bbox = dd2MercMetersLng(ul.x) + "," + dd2MercMetersLat(ul.y) + "," + dd2MercMetersLng(lr.x)+ "," + dd2MercMetersLat(lr.y);
var l_strSRS="SRS=EPSG:54004";
} else {
var bbox = ul.x + "," + ul.y + "," + lr.x + "," + lr.y;
var l_strSRS="SRS=EPSG:4326";
}
var url = url + "REQUEST=GetMap&SERVICE=WMS&VERSION=1.1.1&LAYERS=" + layers + "&STYLES=" + this.Styles + "&FORMAT=" + format + "&BGCOLOR=0xFFFFFF&TRANSPARENT=TRUE&"+l_strSRS+"&BBOX=" + bbox + "&WIDTH=" + ts + "&HEIGHT=" + ;
this.cURL=url;
return url;
}


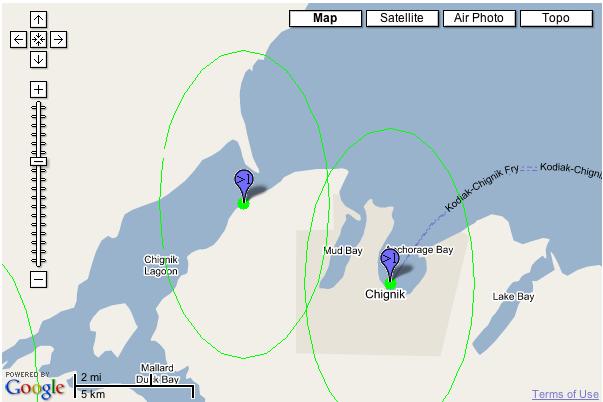
You'll notice in step #6 above that I don't use Mercator for resolutions below 13. This is because I believe the nifty little javascript re-project is not quite as accurate as it can be (hey-- what do you expect from javascript doing reprojections!). Anyway, reverting to latlong at lower zoom levels will fix this.

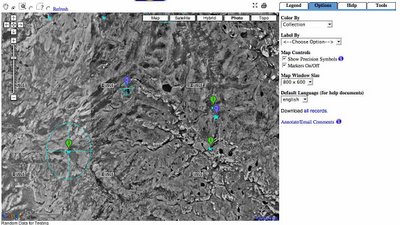
Thats it! The resulting map will looksomething like the screenshot below. The lines going across the top of the Russian Federation, by the way, I think are an artifact of drawing country boundaries across the international dateline. Since I'm only using point data for my real application i didn't worry about this. Not sure if this is an issue but I think it crept in because my source data is stored in geographic units.

Tuesday, September 06, 2005

Measuring flow in a small creek using a simple weir

Recently, I constructed a simple weir for measuring flow in Owen's Creek at the point where our ranch-road crosses the creek. There is an old metal pipe, 8' in diameter which the water flows through, under the road. In front of this pipe I laid a rough-cut 2x10 at the base by digging out gravel in the stream bed. On top of this I placed another rough-cut 2x10 with a four foot rectangular notch. By measuring the head (height of water flowing over the notch) one can determine the flow rate of the water in the stream (See table below).

One improvement I want to make is placing a piece of metal in front of the board and up an inch or so from the level of the notch. This will make a thinner area for the water to flow over which gives a more accurate measurement.

There are still some leaks from the bottom of the weir, running about 25gpm (a conservative guess on my part).
Following are some estimates of streamflow using this method, with an estimated accuracy of +/- 30gpm:


  • July 30th, 2005: 400gpm

  • September 4th, 2005: 315gpm

  • September 23rd, 2005: 250gpm

  • October 1, 2005: 577gpm (1 inch rain in last 24 hours after no rain all summer)

  • Assuming irrigation rates of 96-146gpm, I will be leaving a downstream flow of 165-215gpm flow (using September 4th measurements).

    DISCHARGE FROM A RECTANGULAR WEIR WITH A FOUR-FOOT WIDE CREST GIVEN IN US GALLONS PER MINUTE


    Gauge Reading in InchesGPM
    0.547
    0.7586
    1145
    1.25199
    1.5258
    1.75320
    2387
    2.25476
    2.5552
    2.75628
    3708
    3.25792
    3.5880
    3.75968
    41080
    4.251176
    4.51268
    4.751364
    51472

    Tuesday, August 30, 2005

    WMS overlays and GoogleMap Transparency

    Following are some notes on my experiences in working with WMS layers and GoogleMaps API. Am posting these notes here as I spent alot of time testing in the last couple of weeks on this and maybe this will help someone else out. Following is an image which illustrates what i'm talking about:


    These ideas are not definitive, just some general notes about how to get around.

    1) WMS layering on Googlemaps. Some posts reccomended having two map objects overlaying in separate divs. I drove myself nuts getting the maps to sync and things become more problematic when implementing multiple events to trigger different actions. Plus, this was all super slow. Hence, I opted for combining WMS layers into a single map object.

    2) I integrated a combination of Brian Flood's WMS code and Kyle Mulka's suggestions for handling overlays into a single function to handle WMS overlays (can overlay WMS ontop of GoogleMaps data or other WMS layers such as terraserver). I reccomend working with scripts they have posted rather than anything i have done.

    3) When Google handles overlays in the map object the Style sheets force transparent images to become opaque. Hence filled polygons with translucent properties block out everything. Worse, Google doesn't assign unique id's to any of the divs they create to simplify working with divs. To get around this, I pointed my javascript DOM to the div container for my map container and then searched all child nodes for references to my overlay WMS service and then dynamically changed the style properties. Here is the JS function which updates the appropriate JS elements:
    // adjust Opacity
    function adjustOpacity(p_pctOpacity) {
    if (p_pctOpacity < .01) p_pctOpacity=.01 if (p_pctOpacity >1) p_pctOpacity=1;
    l_intOpacity=p_pctOpacity*100;
    // adjust opacity of overlay layers
    var JStopmap=document.getElementById('topmap').firstChild.childNodes;
    // loop all elements (google tiles)
    for (var i=JStopmap.length-1;i>0;i--) {
    // search for string of overlay layer
    if (JStopmap[i].src!=null) {
    // HACK -- berkeleymapper is a unique string of the WMS service i'm calling
    // this can be anything.
    if (JStopmap[i].src.indexOf('berkeleymapper') > 0) {
    // browsers handle opacity differently, these settings should handle most common methods
    JStopmap[i].style.KthmlOpacity=p_pctOpacity;
    JStopmap[i].style.MozOpacity=p_pctOpacity;
    JStopmap[i].style.filter='Alpha(opacity='+l_intOpacity+')';
    JStopmap[i].style.opacity=p_pctOpacity;
    }
    }
    }
    }

    4) Finally, I implemented a slider bar with some modifications in my script to link it up with the adjustOpacity function. This is from Mark Wilton-Jones library of JS functions
    There were other slider scripts out there but this one seemed easiest to work with, though i don't care much for the colors and it is a bit involved to change the look of the control.

    Wednesday, August 24, 2005

    Fun with projections


    Two error circles representing point certainty are displayed on the first map in geographic space. This rendering is from my first implementation of BerkeleyMapper which used geographic space for all maps.

    The second map displays these same error radii in the second implementation of BerkeleyMapper which leverages GoogleMaps API. Google uses a Mercator projection, which preserves local shape but has a large degree of exaggeration towards the poles. Both of these samples are technically correct I suppose but I'm not so happy with the vertically exaggerated ellipse from the GoogleMaps API example.

    The vertical exaggeration of the ellipse in the second sample, however, is preferable to the "squishing" affect of geographic space, particularly when underlaying USGS topos (as the map text will appear flattened in northern and southern latitudes).